Consistent amplitude scaling across multiple sessions#
This example shows how to pool amplitudes from across multiple sessions, and use this to calculate thresholds for color scaling amplitudes on the plot. This ensures color scaling is comparable across sessions.
from pathlib import Path
import spikeinterface as si
from driftplots import DriftPlotter, get_amplitudes
import matplotlib.pyplot as plt
import numpy as np
# Getting the amplitudes across a set of sorting outputs can be useful to
# compute absolute amplitudes used for filtering spikes based
# on amplitude, or scaling color map values the same across plots.
# Load the data. In this example we load as a SortingAnalyzer
# or from the raw Kilosort output to demonstrate both methods
data_path = Path(__file__).parent / "example_data"
analyzer = si.load_sorting_analyzer(data_path / "analyzer.zarr")
sorting_output_path = data_path / "sorting" / "sorter_output"
all_spike_amplitudes = get_amplitudes(
[analyzer, sorting_output_path], concatenate=False
)
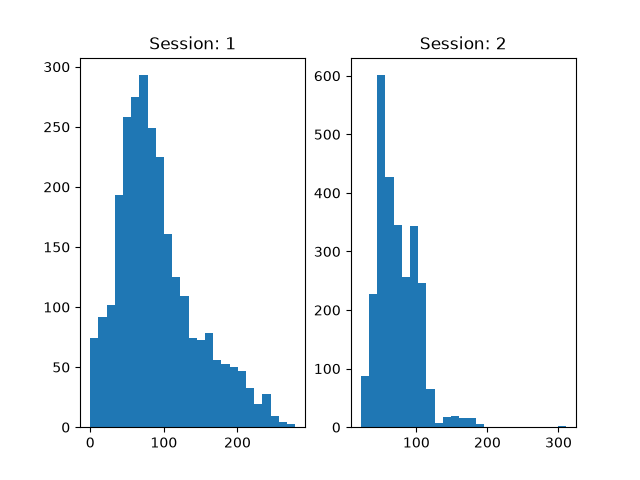
# We can plot the histogram of the amplitudes across
# both sessions to see how similar they are
fig, axes = plt.subplots(1, 2)
for idx, amplitudes in enumerate(all_spike_amplitudes):
axes[idx].hist(amplitudes, bins=25)
axes[idx].set_title(f"Session: {idx + 1}")
plt.show()
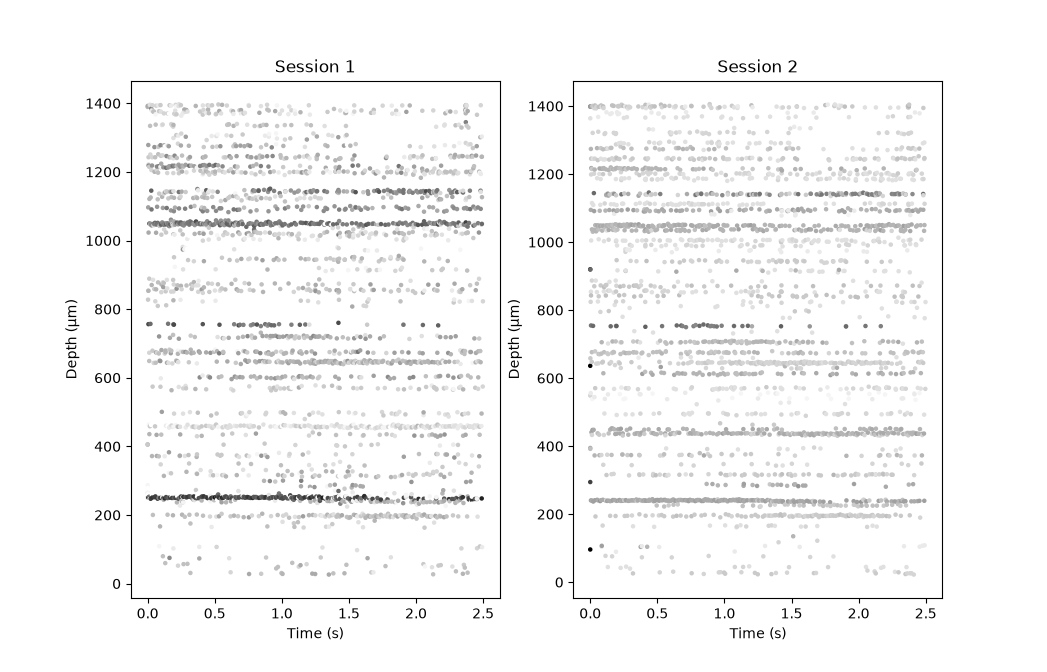
# Finally, we can plot the drift map for both sessions with
# the amplitude color scaled the same for both plots
concat_spike_amplitudes = np.concatenate(all_spike_amplitudes)
min_cutoff, max_cutoff = concat_spike_amplitudes.min(), concat_spike_amplitudes.max()
fig, axes = plt.subplots(1, 2)
for idx, path_or_analyzer in enumerate([analyzer, sorting_output_path]):
plotter = DriftPlotter(path_or_analyzer)
plotter.drift_map_plot_matplotlib(
amplitude_cmap_scaling=(min_cutoff, max_cutoff),
n_color_bins=25,
filter_amplitude_mode="absolute",
filter_amplitude_values=(min_cutoff, max_cutoff),
title=f"Session {idx + 1}",
ax=axes[idx]
)
plt.show()
# You will notice the plots and templates look different, even
# though the underlying data is the same. This is because kilosort
# and SpikeInterface use different methods to compute amplitudes, depths and templates